7. Developer Tutorial: Custom tooltips
We designed Escher to be easily extended by anyone willing to learn a little JavaScript. A few extensions to Escher already exist; you can check out our demos and see Escher in action on the Protein Data Bank. Escher uses standard web technologies (JavaScript, CSS, HTML, SVG), so you can embed it in any web page. We also hope to see users extend the maps by integrating plots, dynamic interactions, and more.
In this tutorial, I will introduce a new extension mechanism in Escher: custom tooltips. The tooltips are already available on Escher maps when you hover over a reaction, metabolite, or gene. The default tooltips provide some information about the object you are hovering over, but any text, links, or pictures could potentially be displayed there.
With a little bit of JavaScript, you can add your own content to the tooltips. In this tutorial, we will add custom text, images, and then plots with D3.js to the tooltips. Here’s what were are building up to (live demo):
To follow along with this tutorial, you will need a basic understanding of HTML, CSS, JavaScript, and SVG. If you have never used these before, check out codecademy.
On the other hand, if you already know JavaScript and the basic Escher API, you can skip to the section Custom tooltips.
7.1. Getting ready to develop with Escher
Before you can make any changes to an Escher map, you will download some source code and set up a local web server. Your local version of Escher will have all of the features from the main website, but you will be able to modify the visualizations and add your own content. First we need to start up a basic static file server.
NOTE: If you already have experience with JavaScript development, you might want
to download Escher from NPM (as escher). If you like Webpack, check out
the escher-test repository.
To get started, download this ZIP file. If you prefer to use git for version control, you can also clone the source code from GitHub.
Then, in your favorite terminal, navigate to into the folder (the one that
contains README.md), and run one of the following commands to start a web
server. You will need to have Python or node.js installed first; if you don’t
have either, read get started with Python first.
# python 2
python -c "import SimpleHTTPServer; m = SimpleHTTPServer.SimpleHTTPRequestHandler.extensions_map; m[''] = 'text/plain'; m.update(dict([(k, v + ';charset=UTF-8') for k, v in m.items()])); SimpleHTTPServer.test();"

# python 3
python -m http.server

# node.js
http-server -p 8000
Open http://localhost:8000/ to see the your web server in action. It should look just like the site here: https://escher.github.io/escher-demo/.
Now, any changes you make to the code in that folder will be reflected next time
you refresh you browser! Try editing the file embedded_map_builder/index.html,
then reload your web browser to see what you’ve changed.
You can see what’s happening under the hood by opening your developer tools (Chrome, Firefox) where you can debug your code and check for error messages.
7.2. How does Escher work?
The starting point for an Escher map is the Builder class. When you create a Builder, you pass in options that define how the map will render: what to display, whether to allow editing, how to style the map, and more. These options are documented in the JavaScript API.
The most basic demo is in the folder embedded_map_builder. Look for the
main.js file that contains a section of JavaScript code that looks like
this:
d3.json('e_coli.iJO1366.central_metabolism.json', function (e, data) {
  if (e) console.warn(e);
  var options = { menu: 'all', fill_screen: true };
  var b = escher.Builder(data, null, null, d3.select('#map_container'), options);
});
That code does three things. First, it uses D3 to load a file (the one that ends
in .json) that contains the layout for a pathway map. Second, it defines
some options for the map. And third, it creates a new Builder, passing in
the loaded data. Escher needs to know where to render the map, so the fourth
argument points to a location on the page (a DOM element) using D3. Check the
HTML in index.html and you will find the line <div
id="map_container"></div>. This is where the new Escher Builder will live.
To test your setup, change the menu option from all to zoom, reload
the page, and see what happens.
Now you are ready to extend Escher!
7.3. Custom tooltips
We’ve designed the tooltip customization process to be as easy and modular as
possible. The Builder will generate a div element to display your tooltip
whenever you mouse over a label or map object associated with a reaction or
metabolite.
7.4. Method 1: Tooltip with random pics
In the custom_tooltips directory, you’ll find a JavaScript file called
main.js that we will use to try out two examples of custom tooltips. The
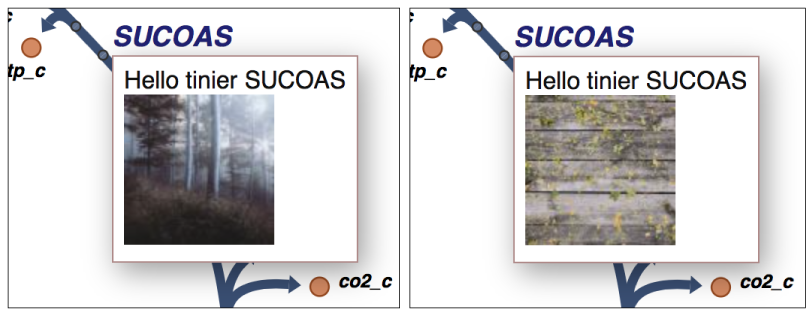
first one, Tooltip1, displays a random image from a web service called
unsplash when you hover over a metabolite label or reaction label:
To activate Tooltip1, look for the following block of code at the end of
main.js and change the variable Tooltip2 to Tooltip1:
var options = {
  menu: 'zoom',
  fill_screen: true,
  never_ask_before_quit: true,
  // --------------------------------------------------
  // CHANGE ME
  tooltip_component: Tooltip2
  // --------------------------------------------------
The open your browser to http://127.0.0.1:8080/custom_tooltips and hover over a reaction or metabolite label to see it in action!
The tooltip is defined like this:
const Tooltip1 = props => {
  return (
    // Style the text based on our tooltip_style object
    h('div', { style: tooltipStyle},
      // Update the text to read out the identifier biggId
      'Hello tooltip world ' + props.biggId,
      // Line break
      h('br'),
      // Add a picture. Get a random pic from unsplash, with ID between 0 and 1000.
      h('img', { src: 'https://unsplash.it/100/100?image=' +  Math.floor(Math.random() * 1000) })
    )
  );
};
Each tooltip receives data from Escher as an data structure called props.
The props include these attributes:
biggId: The ID for the reaction, metabolite, or gene.
name: The display name for the reaction, metabolite, or gene.
loc: The coordinates of the tooltip.
data: Any loaded data associated with the reaction, metabolite, or gene.
type: The type of element (“reaction”, “metabolite”, or “gene”)
Escher uses the Preact library to define tooltips. Preact provides the h
function which specifies the HTML element to create and any attributes and
children (or you can use JSX if you already know how to set it up). Preact is a
variant of the popular React web framework, and there are many resources
available for learning more about it. We recommend this course:
https://www.codecademy.com/learn/react-101
Anything you can do with Preact, you can do in tooltip!
7.5. Method 2: Tooltip with a D3 plot
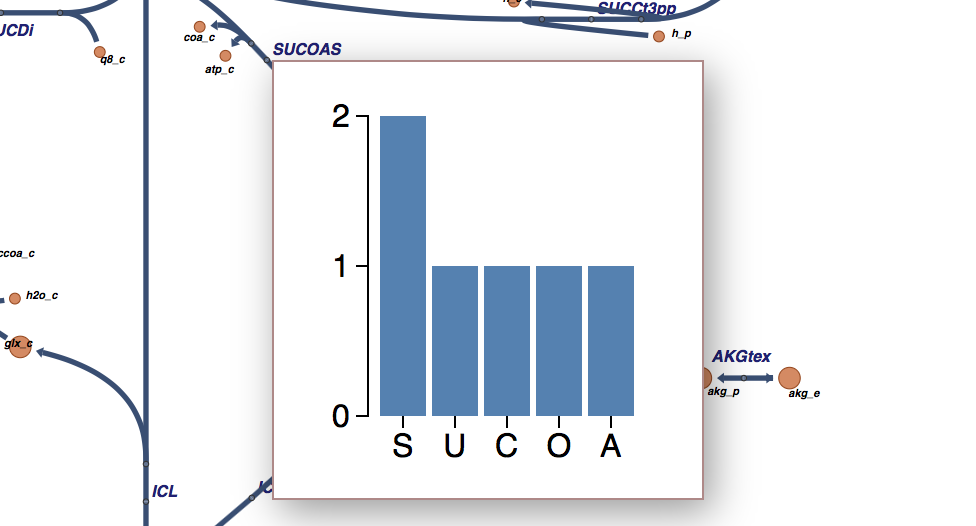
What if we want a data plot in the tooltip? D3.js is great for creating custom plots, so let’s start with this example of a bar plot in D3.
D3 takes a little while to learn, so, if you are interested in expanding on what we show here, I recommend you read through some D3 tutorials. I will only explain the main points here, and you can work through the details as you learn D3.
The complete code for Tooltip2 with bar charts is in
custom_tooltips/main.js. To see it in action, change the tooltip_component
back too Tooltip2 (i.e. undo the changes you made in the last section) and
refresh the demo website.
The new Tooltip also uses Preact to define how it will render, but the Tooltip is now defined as a Preact Component class:
class Tooltip2 extends Component {
  componentShouldUpdate() {
    return false;
  }
  ...
This component tells Preact to create a div by defining this render function:
render() {
  // Style the text based on our tooltip_style object
  return h('div', { style: tooltipStyle });
}
But the rest of the work is deferred to the D3 code in
componentWillReceiveProps. To make sure Preact and D3 play nicely, it is
essential to return false from componentShouldUpdate.
With these pieces in place, the rest of the code defines the particular plot we
will make. Most of the content of componentWillReceiveProps should look like
the D3 example here:
https://bl.ocks.org/mbostock/3310560
There is also a helper function to take the BiGG ID for our reaction, metabolite, or gene and calculate the frequency of each letter:
function calculateLetterFrequency (s) {
  var counts = {}
  s.toUpperCase().split('').map(function (c) {
    if (!(c in counts)) {
      counts[c] = 1
    } else {
      counts[c] += 1
    }
  })
  return Object.keys(counts).map(function (k) {
    return { letter: k, frequency: counts[k] }
  })
}
The end result looks like this:
Pretty cool! This is also the version that’s live on the demo website, so you can see it in action there as well.
With these tools, you should have what you need to build complex, custom features on top of Escher. To see what’s possible, check out Escher-FBA which was built using this exact API:
https://sbrg.github.io/escher-fba
Happy extending!