Welcome to the documentation for Escher
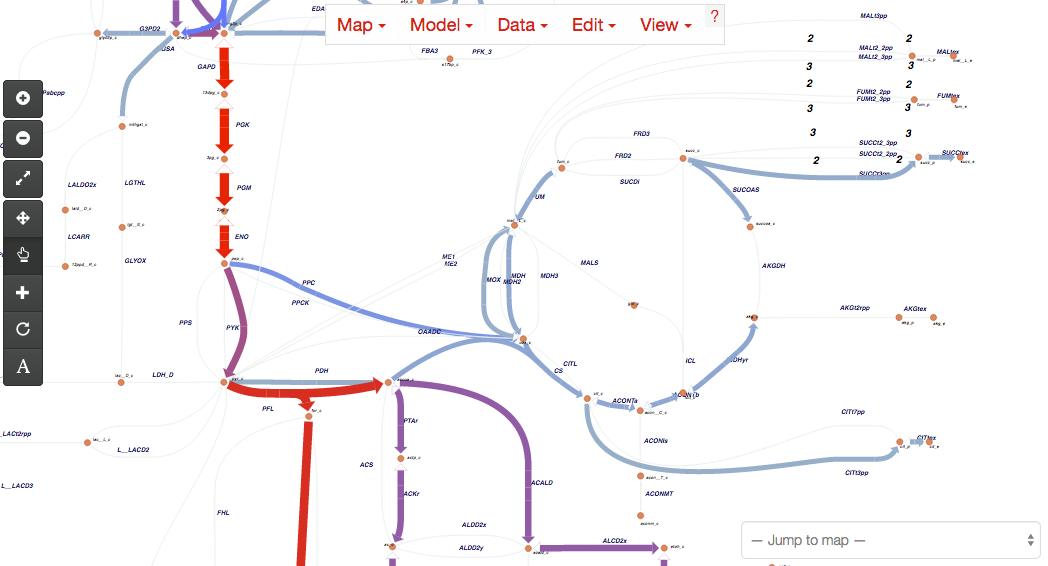
Escher is a web-based tool for building, viewing, and sharing visualizations of biological pathways. These ‘pathway maps’ are a great way to contextualize biological datasets. The easiest way to use Escher is to browse and build maps on the Escher website. New users may be interested in the Getting Started guide.
Help! I just upgraded to v1.0 and my maps will not load!
If you have been using a pre-release version of Escher, you will need to convert your maps to the v1.0 format by following these directions. After version 1.0, the map format will not change until version 2.0.
Features
- View pathway maps in any modern web browser
- Build maps using the content of genome-scale metabolic models
- Visualize data on reactions, genes, and metabolites
- Full text search
- Detailed options for changing colors, sizes, and more, all from the web browser
- View maps inside the IPython Notebook
- Embed maps within any website, with minimal dependencies (escher.js, d3.js, and optionally Twitter Bootstrap)
Supported browsers
We recommend using Google Chrome for optimal performance, but Escher will also run in the latest versions of Firefox, Internet Explorer, and Safari (including mobile Safari).
Installation
Escher can be used without any installation by visiting the Escher website. However, you can install escher if you would like to (1) run Escher offline, (2) include your own maps and models in the launch page, (3) view Escher maps in an IPython Notebook, or (4) modify the source code.
To install the latest stable version of Escher, run:
pip install escher
For more information, see the documentation on Escher in the IPython Notebook and Developing with Escher.
Contents
License
Escher is licensed under the MIT license.