7. Tutorial: Custom tooltips
We designed Escher to be easily extended by anyone willing to learn a little JavaScript. A few extensions to Escher already exist; you can check out our demos and see Escher in action on the Protein Data Bank. Escher uses standard web technologies (JavaScript, CSS, HTML, SVG), so you can embed it in any web page. We also hope to see users extend the maps by integrating plots, dynamic interactions, and more.
In this tutorial, I will introduce a new extension mechanism in Escher: custom tooltips. The tooltips are already available on Escher maps when you hover over a reaction, metabolite, or gene. The default tooltips provide some information about the object you are hovering over, but any text, links, or pictures could potentially be displayed there.
With a little bit of JavaScript, you can add your own content to the tooltips. In this tutorial, we will add custom text, images, and then plots with D3.js to the tooltips. Here’s what were are building up to (live demo):
To follow along with this tutorial, you will need a basic understanding of HTML, CSS, JavaScript, and SVG. If you have never used these before, check out codecademy.
On the other hand, if you already know JavaScript and the basic Escher API, you can skip to the section Custom tooltips.
7.1. Getting ready to develop with Escher
Before you can make any changes to an Escher map, you will download some source code and set up a local web server. Your local version of Escher will have all of the features from the main website, but you will be able to modify the visualizations and add your own content. First we need to start up a basic static file server.
NOTE: If you already have experience with JavaScript development, you might want
to download Escher from NPM (as escher-vis). If you like Webpack, check out
the escher-test repository.
To get started, download this ZIP file. If you prefer to use git for version control, you can also clone the source code from GitHub.
Then, in your favorite terminal, navigate to into the folder (the one that
contains README.md), and run one of the following commands to start a web
server. You will need to have Python or node.js installed first; if you don’t
have either, get started with Python first.
# python 2
python -c "import SimpleHTTPServer; m = SimpleHTTPServer.SimpleHTTPRequestHandler.extensions_map; m[''] = 'text/plain'; m.update(dict([(k, v + ';charset=UTF-8') for k, v in m.items()])); SimpleHTTPServer.test();"

# python 3
python -m http.server

# node.js
http-server -p 8000
Open http://localhost:8000/ to see the your web server in action. It should look just like the site here: https://escher.github.io/escher-demo/.
Now, any changes you make to the code in that folder will be reflected next time
you refresh you browser! Try editing the file embedded_map_builder/index.html,
then reload your web browser to see what you’ve changed.
You can see what’s happening under the hood by opening your developer tools (Chrome, Firefox) where you can debug your code and check for error messages.
7.2. How does Escher work?
The starting point for an Escher map is the Builder class. When you create a Builder, you pass in options that define how the map will render: what to display, whether to allow editing, how to style the map, and more. These options are documented in the JavaScript API.
The most basic demo is in the folder embedded_map_builder. Look for the
main.js file that contains a section of JavaScript code that looks like
this:
d3.json('e_coli.iJO1366.central_metabolism.json', function (e, data) {
  if (e) console.warn(e);
  var options = { menu: 'all', fill_screen: true };
  var b = escher.Builder(data, null, null, d3.select('#map_container'), options);
});
That code does three things. First, it uses D3 to load a file (the one that ends
in .json) that contains the layout for a pathway map. Second, it defines
some options for the map. And third, it creates a new Builder, passing in
the loaded data. Escher needs to know where to render the map, so the fourth
argument points to a location on the page (a DOM element) using D3. Check the
HTML in index.html and you will find the line <div
id="map_container"></div>. This is where Escher lives.
To test your setup, change the menu option from all to zoom, reload
the page, and see what happens.
Now you are ready to extend Escher!
7.3. Custom tooltips
We are going to modify the Escher tooltips, first with simple text, and then
with some pictures and plots. We will start with the code in the folder
custom_tooltips, and you should already be able to see the output at
http://localhost:8000/custom_tooltips.
7.4. Method 1: Callback function
The simplest tooltip is just a function that Escher will call whenever a user
pilots the mouse over a metabolite, reaction, or gene. In the main.js for
custom_tooltips, we can set our tooltip function with the tooltip_component
option.
var options = {
  menu: 'zoom',
  fill_screen: true,
  // --------------------------------------------------
  // CHANGE ME
  tooltip_component: tooltips_4,
  // --------------------------------------------------
}
First, let’s change tooltips_4 to the simplest tooltip,
tooltips_1. tooltips_1 is a function that we define earlier in
main.js. Here’s what it looks like:
var tooltips_1 = function (args) {
// Check if there is already text in the tooltip
if (args.el.childNodes.length === 0) {
// If not, add new text
var node = document.createTextNode('Hello ')
args.el.appendChild(node)
// Style the text based on our tooltip_style object
Object.keys(tooltip_style).map(function (key) {
args.el.style[key] = tooltip_style[key]
})
}
// Update the text to read out the identifier biggId
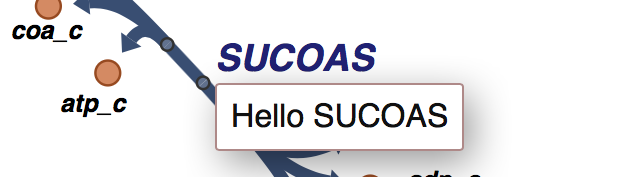
args.el.childNodes[0].textContent = 'Hello ' + args.state.biggId
}
And when you hover over a reaction on the page, you will see this:
The function looks a little complicated, but what we are doing is extremely
simple. The first thing to look at is that args object. Escher gives you all
the data you need to render your tooltips through args. Try adding this line
to the function and reloading:
var tooltips_1 = function (args) {
  console.log(args) // NEW
  // Check if there is already text in the tooltip
  if (args.el.childNodes.length === 0) {
Now, open your developer tools, and, when you hover over a reaction, and you can see exactly what we’re working with. After you hover a few times, the console should contain something like this:
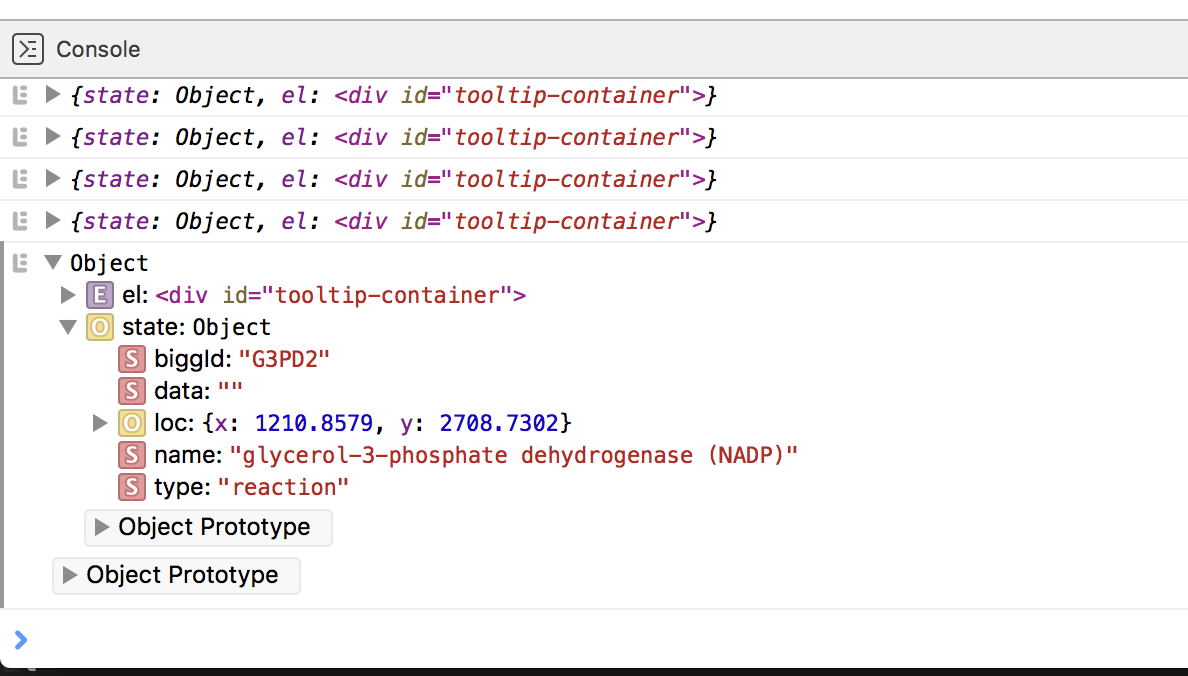
So there you have it! Escher passes you args.el, the location on the page
(DOM element) inside the active tooltip, and args.state, an object with
details about the element you just hovered over.
The rest of the tooltip function takes el and adds some text to it. Browsers
contain some built-in functions like document.createTextNode for modifying
the page, and with a little reading on MDN, you can probably make sense of
it. But there is a better way! Because these built-in methods are long and
boring, we created a some shortcuts for this kind of basic DOM manipulation, and
that’s what the next section is all about.
7.5. Method 2: Callback function with Tinier for rendering
The shortcuts we will use are part a the Tinier library. Tinier looks a lot like the popular JavaScript framework React, but it is meant to be tiny (get it?) and modular so you can use it just to render a few DOM elements inside a tooltip. (In place of Tinier, you could also use a library like JQuery. That’s not a bad idea if you alreay have experience with it.)
The reasons for using Tinier will be a lot more obvious if we look at the second
tooltip. Here is the code. NOTE: If you look at the code in escher-demo,
tooltip_2 is more complicated. We are working up to that version.
var tooltips_2 = function (args) {
  // Use the tinier.render function to render any changes each time the
  // tooltip gets called
  tinier.render(
    args.el,
    // Create a new div element inside args.el
    tinier.createElement(
      'div',
      // Style the text based on our tooltip_style object
      { style: tooltip_style},
      // Update the text to read out the identifier biggId
      'Hello tinier ' + args.state.biggId
    )
  )
}
OK, let’s compare tooltips_2 to tooltips_1. Both functions take
args, and both function render something inside of args.el. The new
function uses two pieces of Tinier. First, tinier.render will take a
location on the page (args.el) and render a Tinier element. Second,
tinier.createElement defines a Tinier version of a DOM element, in this case
a div. To create an Alement, you pass in a tag name, an object with
attributes for the element like styles, and any children of the div. In this
case, the only child is some text that says ‘Hello tinier’ with the biggId.
If you compare tootips_2 and tooltips_1 in detail, you might notice that
tooltips_2 does not have any if statements. That’s becuase Tinier lets
you define your interface once, up front, and then it will determine whether any
changes need to be made. If a div already exists, Tinier will just modify it
instead of creating a new one. In the old version, we would have to use if
to check whether changes are necessary.
Change tooltips_1 to tooltips_2 in this block, and refresh to see our
new tooltip in action.
var options = {
  menu: 'zoom',
  fill_screen: true,
  // --------------------------------------------------
  // CHANGE ME
  tooltip_component: tooltips_2,
  // --------------------------------------------------
}
7.6. Method 3: Tooltip with random pics
We have a pretty simple tooltip, so let’s add something interesting to it. Try
replacing tooltips_2 with tooltips_3, which looks like this:
var tooltips_3 = function (args) {
  // Use the tinier.render function to render any changes each time the
  // tooltip gets called
  tinier.render(
    args.el,
    // Create a new div element inside args.el
    tinier.createElement(
      'div',
      // Style the text based on our tooltip_style object
      { style: tooltip_style},
      // Update the text to read out the identifier biggId
      'Hello tinier ' + args.state.biggId,
      // Line break
      tinier.createElement('br'),
      // Add a picture
      tinier.createElement(
        'img',
        // Get a random pic from unsplash, with ID between 0 and 1000
        { src: 'https://unsplash.it/100/100?image=' +  Math.floor(Math.random() * 1000) }
      )
    )
  )
}
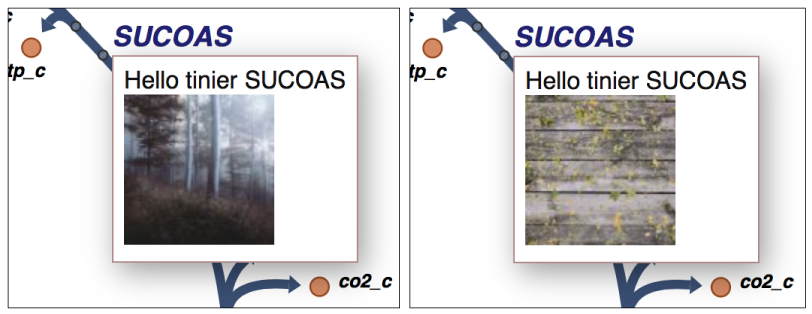
So what happened there? We just added two new elements inside our div. The
br creates a linebreak. And the img creates a new image. We are pulling
images from a website call unsplash that will return a different image for each
of our random integer values.
Try it out! You should get a tooltip like this, with a different picture every time:
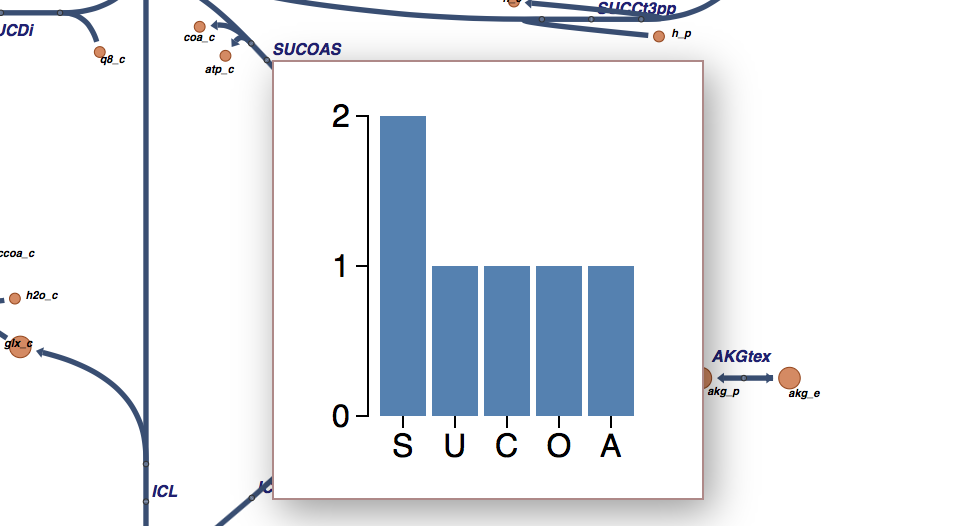
7.7. Method 4: Tooltip with a D3 plot
What if we want a data plot in the tooltip? D3.js is great for creating custom plots, so let’s start with this example of a bar plot in D3:
https://bl.ocks.org/mbostock/3310560
D3 takes a little while to learn, so, if you are interested in expanding on what we show here, I recommend you read through some D3 tutorials. I will only explain the main points here, and you can work through the details as you learn D3.
The complete code for tooltips_4 with bar charts is in
custom_tooltips/main.js.
var tooltips_4 = function (args) {
  // Use the tinier.render function to render any changes each time the
  // tooltip gets called
  tinier.render(
    args.el,
    // Create a new div element inside args.el
    tinier.createElement(
      'div',
      // Style the text based on our tooltip_style object
      { style: tooltip_style }
    )
  )
  ...
So we still create and style a tooltip, but now we are going to fill it with a plot. Next, we take the biggID for our reaction, metabolite, or gene, and we calculate the frequency of each letter.
// Let's calculate the frequency of letters in the ID
var letters = calculateLetterFrequency(args.state.biggId)
You can look at the calculateLetterFrequency function; basic JavaScript.
function calculateLetterFrequency (s) {
  var counts = {}
  s.toUpperCase().split('').map(function (c) {
    if (!(c in counts)) {
      counts[c] = 1
    } else {
      counts[c] += 1
    }
  })
  return Object.keys(counts).map(function (k) {
    return { letter: k, frequency: counts[k] }
  })
}
The rest of tooltips_4 takes our frequency data and turns it into a bar
chart. This code is just an adaptation of the example we mentioned above:
https://bl.ocks.org/mbostock/3310560
For the details on how this works, check out the tutorials called “How to build a bar chart.” The end result looks like this:
Pretty cool! This is also the version that’s live on the demo website, so you can see it in action there as well.
7.8. Method 5: Tinier Component with state
We have just one more example before you have complete control over all things tooltip. As you develop more components like tooltips, you might find a need for some kind of memory in your component. A function, like the ones we have seen so far, runs from scratch every time. You can keep memory in global variables, but that gets hairy, fast.
We take an approach inspired by the Redux library, and you can read more about this approach in the excellent Redux documentation. Tinier uses some of the concepts from Redux, specifically reducers and immutable state.
Here is our example of a tooltip with memory; it will count the number of times you hover:
var tooltips_5 = tinier.createComponent({
  init: function () {
    return {
      biggId: '',
      count: 0,
    }
  },

  reducers: {
    setContainerData: function (args) {
      return Object.assign({}, args.state, {
        biggId: args.biggId,
        count: args.state.count + 1,
      })
    },
  },

  render: function (args) {
    tinier.render(
      args.el,
      tinier.createElement(
        'div', { style: tooltip_style },
        'Hello tinier ' + args.state.biggId + ' ' + args.state.count
      )
    )
  }
})
We can pass this Tinier component right into our Escher Builder. Just like in
Redux, every time we want to change the state (memory) of our component, we will
call a reducer function. Escher expects you to define a reducer called
setContainerData that will be called every time the data for the tooltip
updates, and this will trigger the render if the state changes.
The Tinier documentation has some more details on the concepts. Tinier is still beta software and is in active development. If you get this far in the tutorial, and you want to ask questions about how Tinier works and the plans for its future, you can make an issue on GitHub, or email zaking@ucsd.edu and he (I) will excited to talk about it.